In this post, I’m going to talk about the differences between some of the set analysis operators. … Okay, I’ll agree that the world probably doesn’t need another blog post on set analysis, but I’m going to focus specifically on the four operators that I think are underused. I get a lot of questions from users about set analysis and this topic has come up three or four times in the past month. I’ve even answered a few community posts on this very topic.
The operators are += *= -= /=
If you’ve never used these, or if you wonder why you might use them then this post is for you.
Let’s look at a very simple example that I’ll be using to illustrate these.
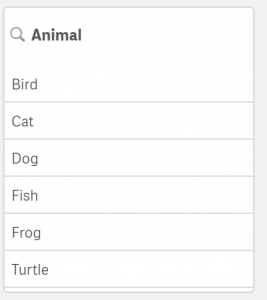
I’ve loaded a Qlik Sense app with the following animal names (and unique IDs to use as a dimension values).
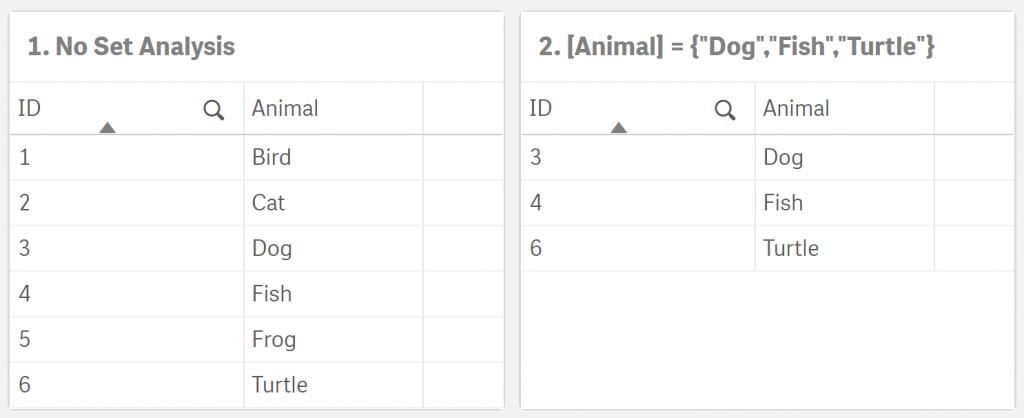
Here are two simple tables that display those values. My dimension is “ID” and my measure is MaxString([Animal]). There’s only one value of [Animal] for each ID, but I’ve used MaxString so that I can demonstrate some set analysis expressions.
In the first table, I’ve just listed all the animals. In the second table I’ve used the following set analysis expression.
[Animal] = {“Dog”,”Fish”,”Turtle”} “only values of [Animal] that are “Dog” or “Fish” or “Turtle”
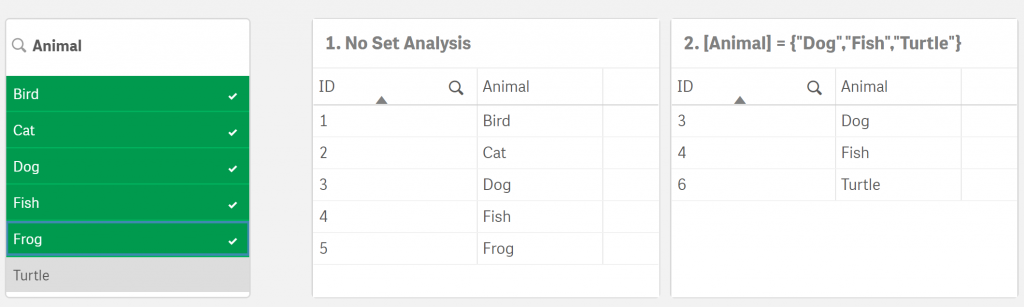
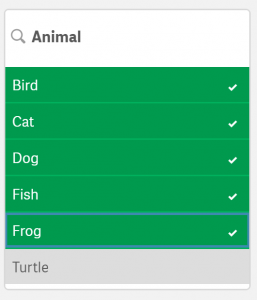
So far, it’s simple—this is the basic set analysis that we use most often. But, let’s examine what happens when the user filters some values. I’ve selected five of the animals below.
Table #1 shows exactly what we expect but look again at table #2. The values don’t match the filtered values I’ve selected. Some of the selected values are missing and one of the values displayed is the one I excluded.
This is where the users were confused. Is something wrong? What’s going on in table #2?
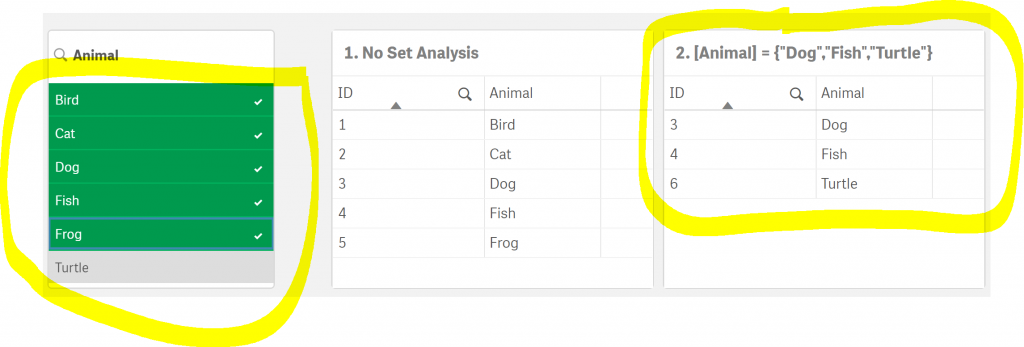
Answer: Exactly what is supposed to be going on—this is how set analysis works. The “=” (equal sign) in the expression:
[Animal] = {“Dog”,”Fish”,”Turtle”}
means, “only values of [Animal] that are Dog or Fish or Turtle, no matter what values are filtered.” In other words, using only the equal sign overrides the filter criteria with only the values in the set analysis expression.
Most of the time, this is exactly what we want it to do, however, in many cases we actually do want to consider both the filters and set analysis. This is exactly what those users wanted to happen and it’s what confused them.
Fortunately, Qlik provides a solution for this.
Back to those operators += *= -= /= that I mentioned earlier. These are what we use when we also want to consider the filtered values.
Stand back, because we’re about to put the “Set” in “Set Analysis”—and YES—there will be Venn diagrams.
Set Analysis Operators To The Rescue
Think about the following set analysis expression
{< [Animal] += {“Dog”,”Fish”,”Turtle”} >}
as
{< [Field] operator {Comparison Values} >}
Or, in other words
{< Filtered Values on the left of the operator Comparison Values on the right >}
Filtered Values is the set of all the values for a field that we’ve selected in a filter for that field. If nothing has been filtered, then it contains all the values. In the filter shown below, those values are
Bird, Cat, Dog, Fish, Frog
Comparison Values is the set of all the values that are specified in the set analysis expression. In the examples below, these will be
Dog, Fish, Turtle
Set Analysis Operators
Now let’s look at those four operators and learn about what they do.
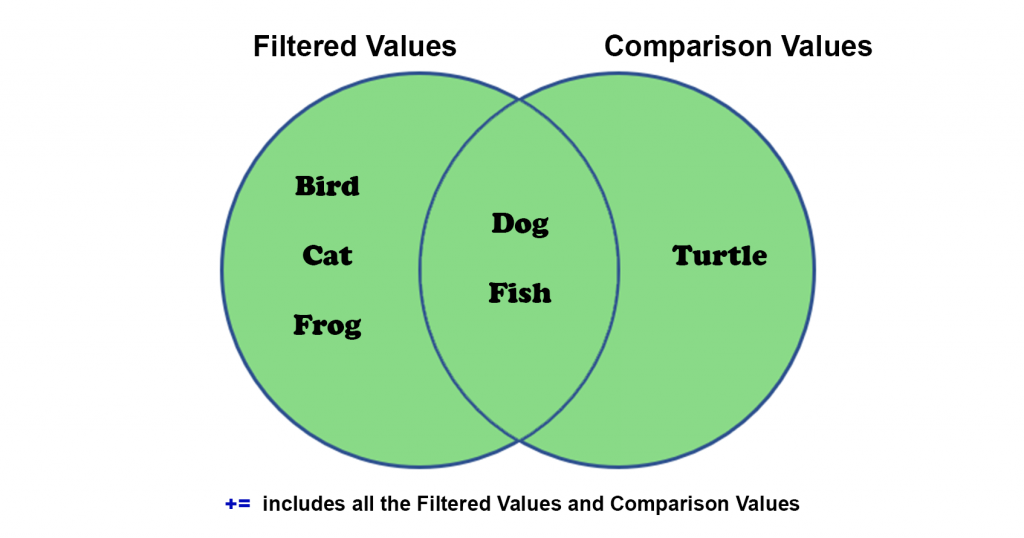
+=The Union operator Definition: “Return the set containing the values that belong to any of the Filtered Values or Comparison Values.”
In English: “I want the result to include all of the filtered values and the comparison values.”
This is the diagram that represents the set analysis expression.
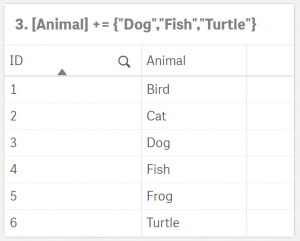
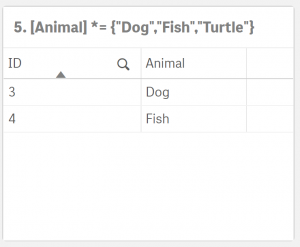
This is the resulting table. The items in the table are the ones that are shaded green in the diagram above.
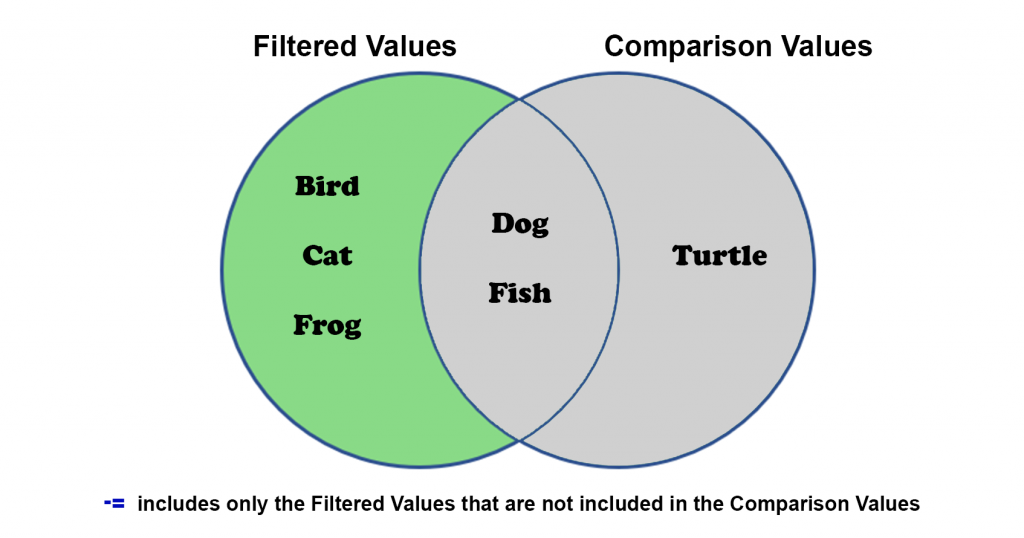
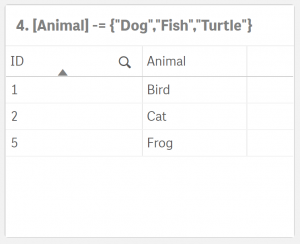
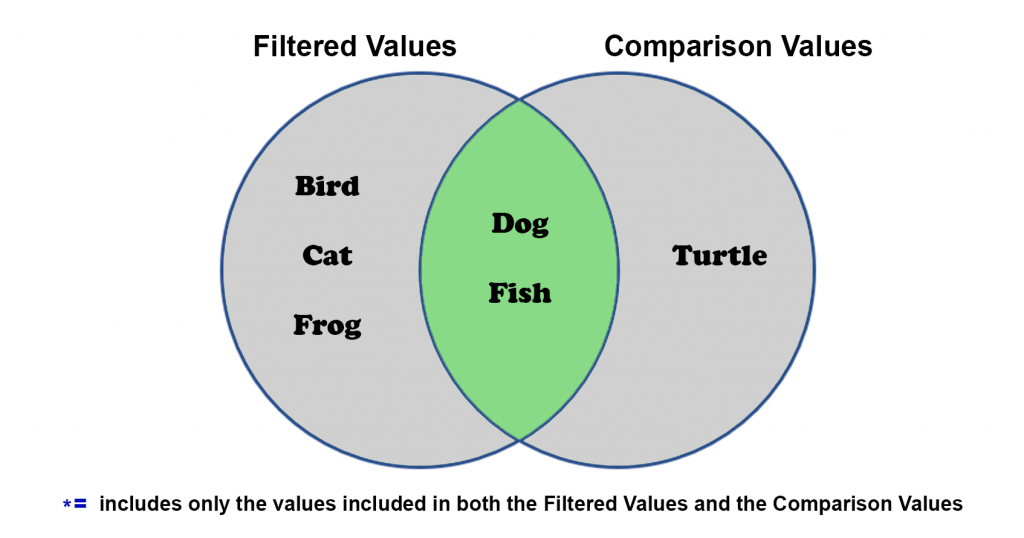
-=The Exclusion operator Definition: “Return the set containing the values that belong to the Filtered Values only if the value is not part of the set of Comparison Values.”
In English: “I want the result to include all of the filtered values except for those that are the comparison values.”
This is the diagram that represents the set analysis expression.
This is the resulting table. The items in the table are the ones that are shaded green in the diagram above.
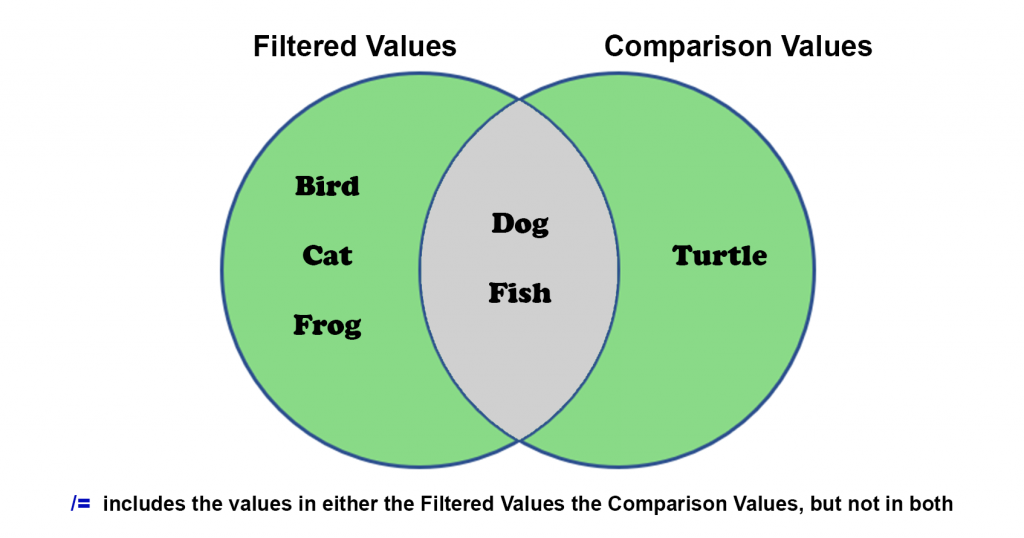
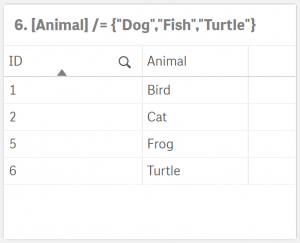
/=The Symmetric Difference (XOR) operator Definition: “Return the set containing the values that belong to either, but not both of the Filtered Values and Comparison Values.”
In English: “I want the result to include all of the filtered values and comparison values that do not match.”
This is the diagram that represents the set analysis expression.
This is the resulting table. The items in the table are the ones that are shaded green in the diagram above.
All of this may seem confusing at first but learning how to use these operators will enable you to deliver much more robust features in your visualizations. Try them out on your own data sets. Please post any questions or area that you’d like to see explained further in the comments below.
3 Comments
Tank Liu
This is the best article that explains logical operations of set analysis in Qlik. Thank you, Leslie.
This is the best article that explains logical operations of set analysis in Qlik. Thank you, Leslie.
Thanks! I’m so glad this was helpful.
merci !!!!!!! tout est clair pour moi maintenant